Outfit   Leg
1   Pink First
2  Green First
3   Pink First
4  Green First
5  Green First
6   Pink First
Now, let’s look at the outfit transitions by creating a transition matrix using a simple function transition_matrix, which takes a sequence of categorical events and returns a table of the number of observed transitions between each event (in our case named outfits).
transitions <-function(x) { n <-length(x)table(x[-n], x[-1])}
Looking at the outfit transitions.
data$Outfit |>transitions() |> knitr::kable(caption ="Outfit transitions of Swift's Eras tour")
Outfit transitions of Swift’s Eras tour
Blue
Blurple
Cotton candy
Flamingo pink
Grapefruit
Green
Ocean blue
Pink
Popsicle
Sunset orange
Yellow
Blue
1
0
0
1
0
1
0
3
0
0
3
Blurple
0
3
1
0
2
0
0
0
0
0
0
Cotton candy
0
1
0
0
0
0
0
0
2
0
0
Flamingo pink
0
0
0
1
0
0
4
0
0
10
0
Grapefruit
0
0
1
0
0
0
0
0
2
0
0
Green
3
0
0
0
0
2
0
7
0
0
8
Ocean blue
0
0
0
8
0
0
0
0
0
6
0
Pink
2
0
0
0
0
11
0
7
0
0
9
Popsicle
0
2
0
0
1
0
0
0
0
1
0
Sunset orange
0
1
1
5
0
0
10
0
0
3
0
Yellow
3
0
0
0
0
6
0
11
0
0
3
This is quite a sparse table (we know some outfits didn’t appear until later legs of the tour). So, let’s consider the transitions for each of the three main legs.
## first legfirst_leg <- data[data$Leg =="First", "Outfit"]first_leg |>transitions() |> knitr::kable(caption ="Outfit transitions for the first leg of Swift's Eras tour")
Outfit transitions for the first leg of Swift’s Eras tour
Blue
Green
Pink
Yellow
Blue
1
1
3
3
Green
3
2
7
8
Pink
2
11
7
9
Yellow
3
6
11
3
## europe legmid_leg <- data[data$Leg =="Europe", "Outfit"]mid_leg |>transitions() |> knitr::kable(caption ="Outfit transitions for the European leg of Swift's Eras tour")
Outfit transitions for the European leg of Swift’s Eras tour
Flamingo pink
Ocean blue
Sunset orange
Flamingo pink
1
4
10
Ocean blue
8
0
6
Sunset orange
5
10
3
## final legfinal_leg <- data[data$Leg =="Final", "Outfit"]final_leg |>transitions() |> knitr::kable(caption ="Outfit transitions for the final leg of Swift's Eras tour")
Outfit transitions for the final leg of Swift’s Eras tour
Blurple
Cotton candy
Grapefruit
Popsicle
Sunset orange
Blurple
3
1
2
0
0
Cotton candy
1
0
0
2
0
Grapefruit
0
1
0
2
0
Popsicle
2
0
1
0
1
Sunset orange
1
0
0
0
0
3.1 A \(\chi^2\)-test for the transition counts
Likely, the first standard hypothesis test you think of for count/contingency data is the \(\chi^2\)-test (or the chi-squared test). Essentially, this works by testing for equal transition rates (if the outfit choices were completely random we’d expect equal numbers of transitions between the outfits); Slightly more formally,
\(H_0 = \text{row outfits independent of column outfits}\) vs. \(H_1 = \text{row outfits not independent of column outfits}\).
## first legfirst_leg |>transitions() |>chisq.test()
Table 3.1: Summary of the chi-squared tests on the transition matricies for each leg of the Eras tour.
Chi-squared statistic
Degrees of freedom
p-vlaue
First Leg
10.259
9
0.330
European Leg
19.554
4
0.001
Final Leg
17.337
16
0.364
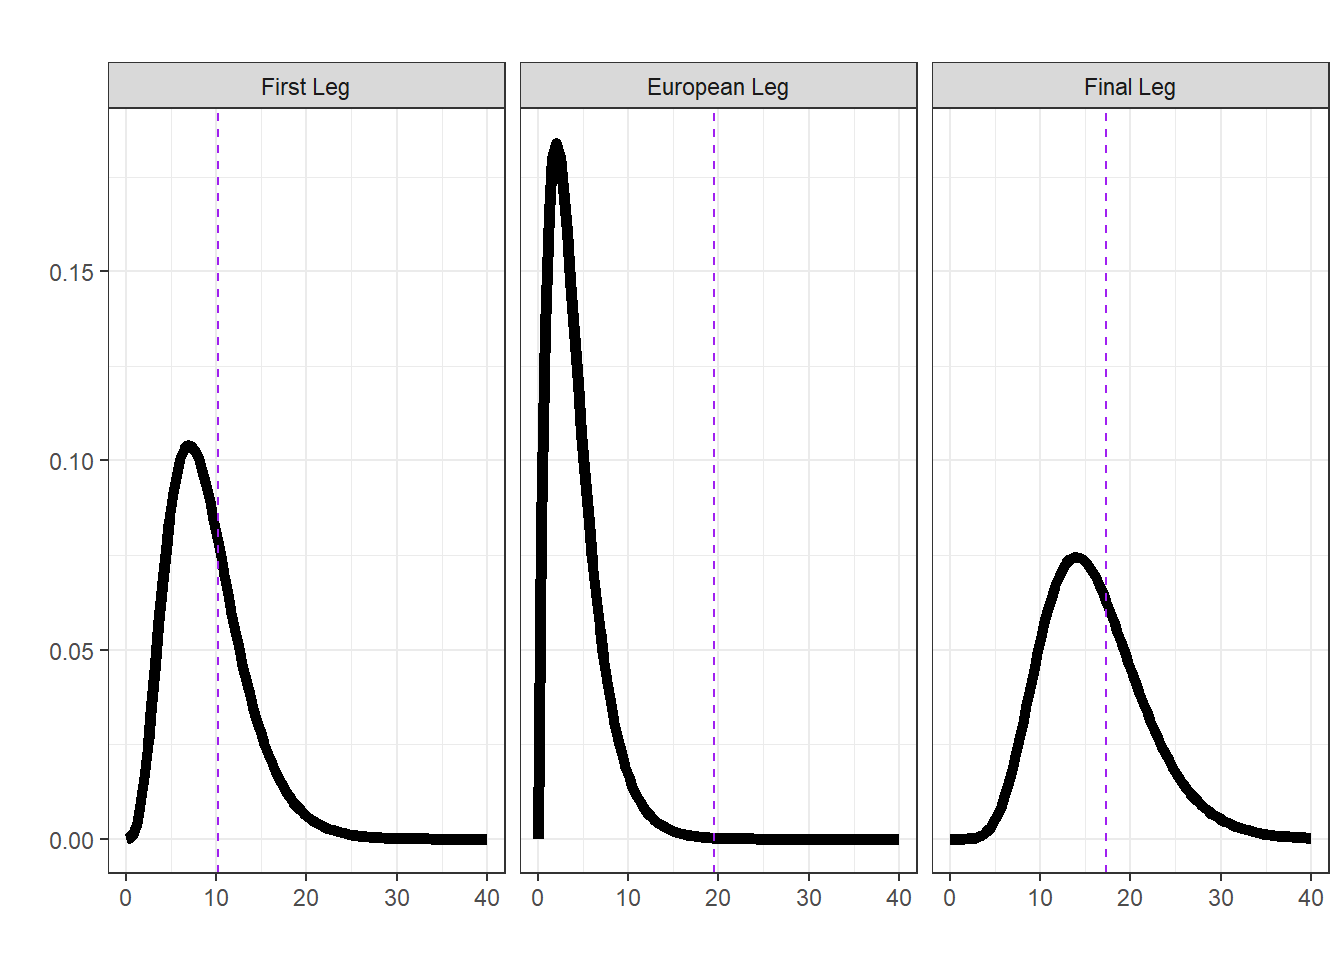
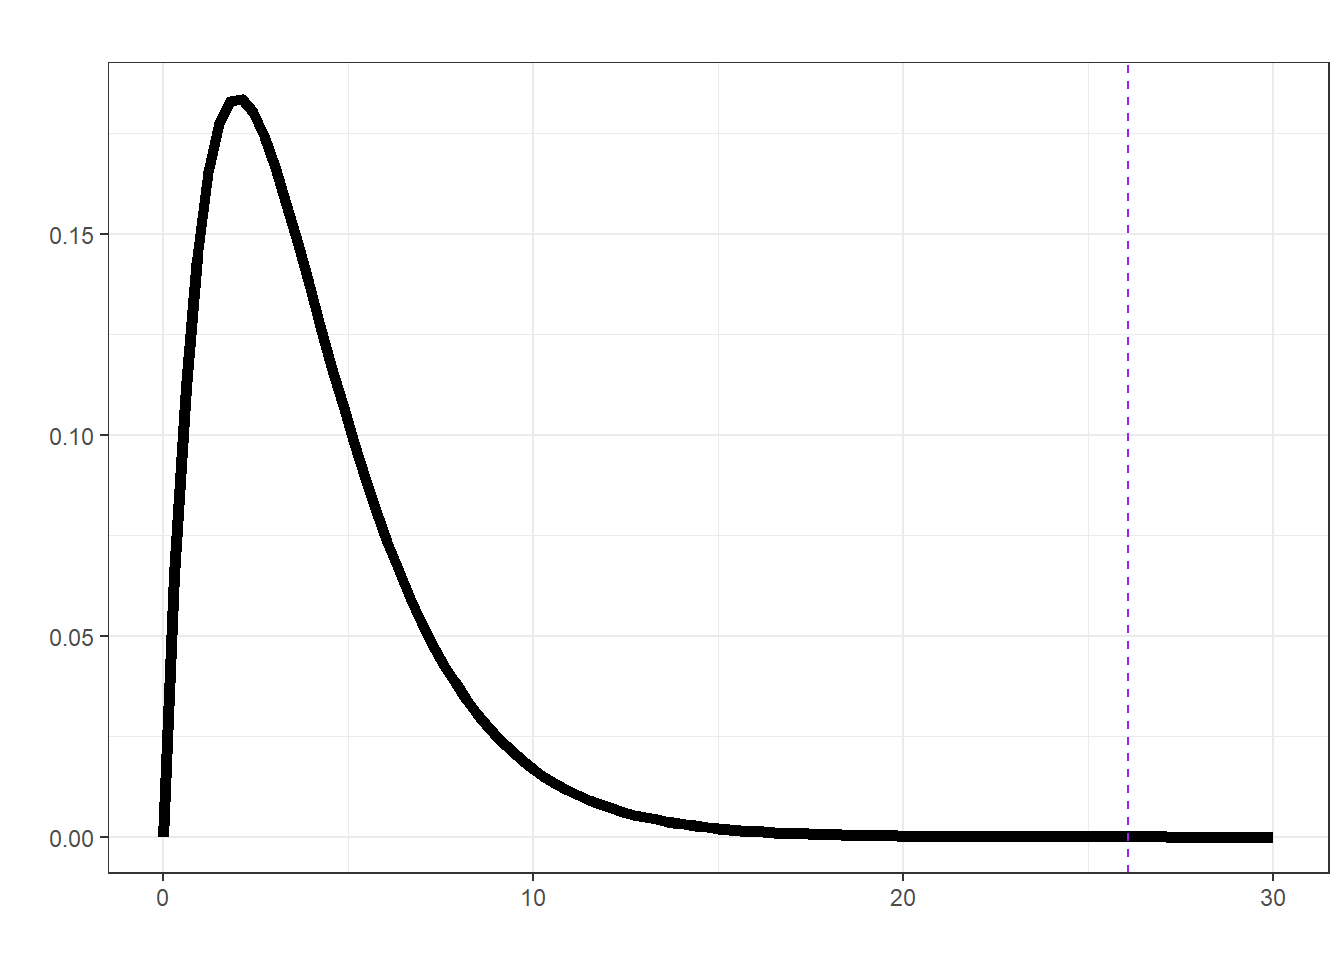
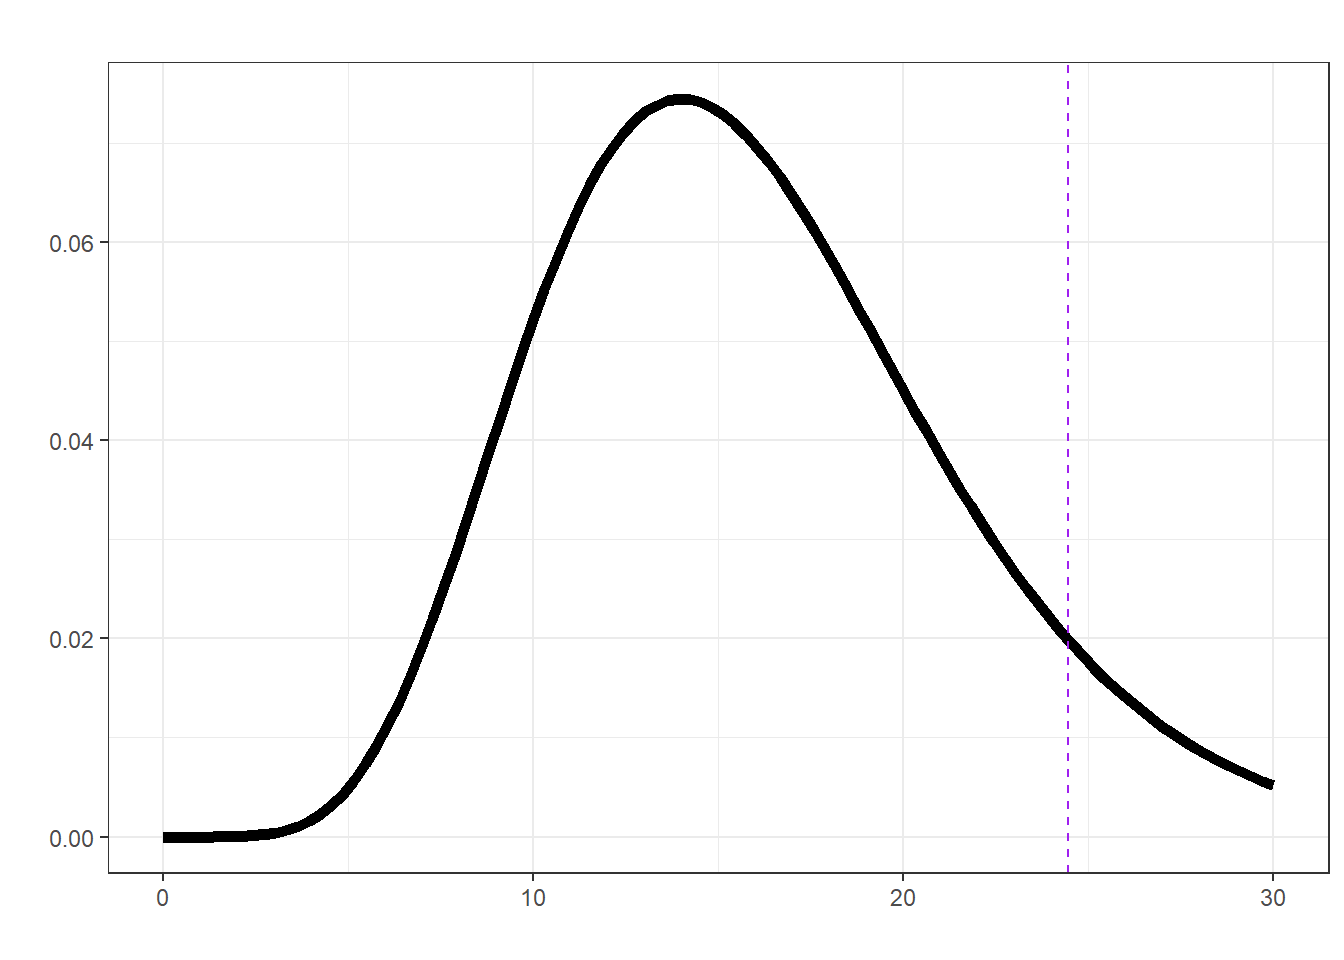
Therefore, if our \(\chi^2\) assumptions were met we might infer that there’s some evidence against the outfits for the European leg being random.
Chi-squared distribution under the NULL hypothesis for each leg along with the observed chi-squared statistic in purple.
3.2 A randomisation test
If we’re not happy that our parametric assumptions are met then we can (often) fall back on simple resampling methods; basically simulating what would happen under chance alone and then comparing how our observed situation stack up!
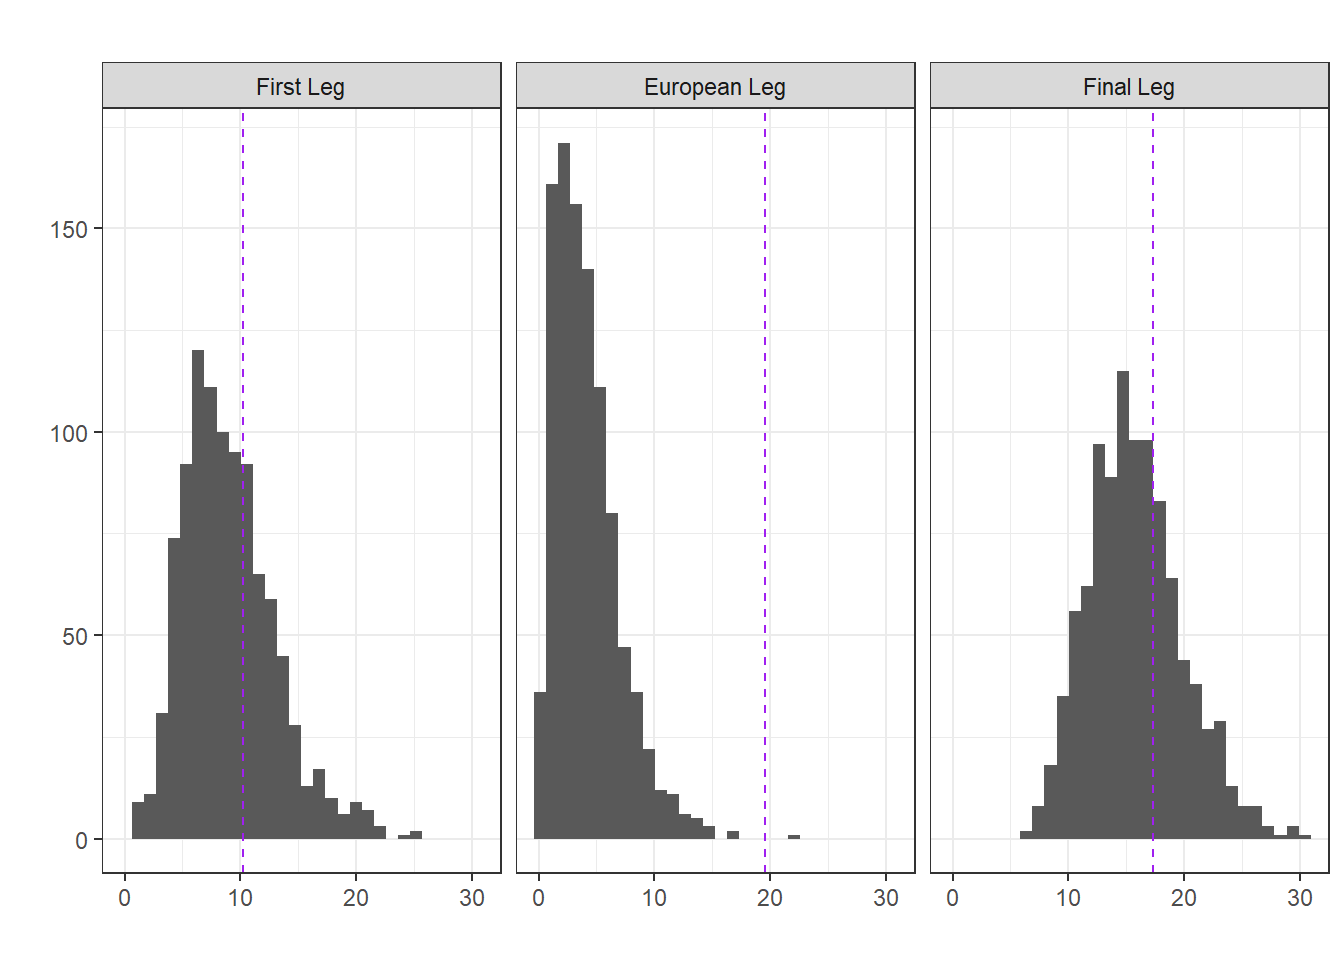
To begin with let’s use the \(\chi^2\)-squared statistic to represent the transition matrix we observed for each leg (it is a valid metric comparing between what we expected under independence and what we observed). By using a randomisation test we can build up a sampling distribution of this chosen metric that represent what would happen under chance alone (i.e., without any assumptions about the shape of this distribution). Our observed statistics in this case are given in the first column of Table 3.1.
## create a function for the randomisation test using chi-sq## on the transition matrix, using a for loop just bcrandomisation <-function(data, nreps =1000, seed =1984){ sampling_dist <-numeric(nreps)set.seed(seed) for (i in1:nreps) { sampling_dist[i] <-suppressWarnings(sample(data) |>transitions() |>chisq.test())$statistic }return(sampling_dist)}
Calculating a p-value (note they’re all pretty much the same as above!).
## first legnull_first <-randomisation(first_leg)mean(null_first >= (first_leg |>transitions() |>chisq.test())$statistic)
[1] 0.336
## European legnull_mid <-randomisation(mid_leg)mean(null_mid >= (mid_leg |>transitions() |>chisq.test())$statistic)
[1] 0.001
## Final legnull_final <-randomisation(final_leg)mean(null_final >= (final_leg |>transitions() |>chisq.test())$statistic)
[1] 0.322
Sampling distribution of the test statistic (the chi-squared statistic) under the NULL hypothesis for each leg along with the observed test statistic in purple.
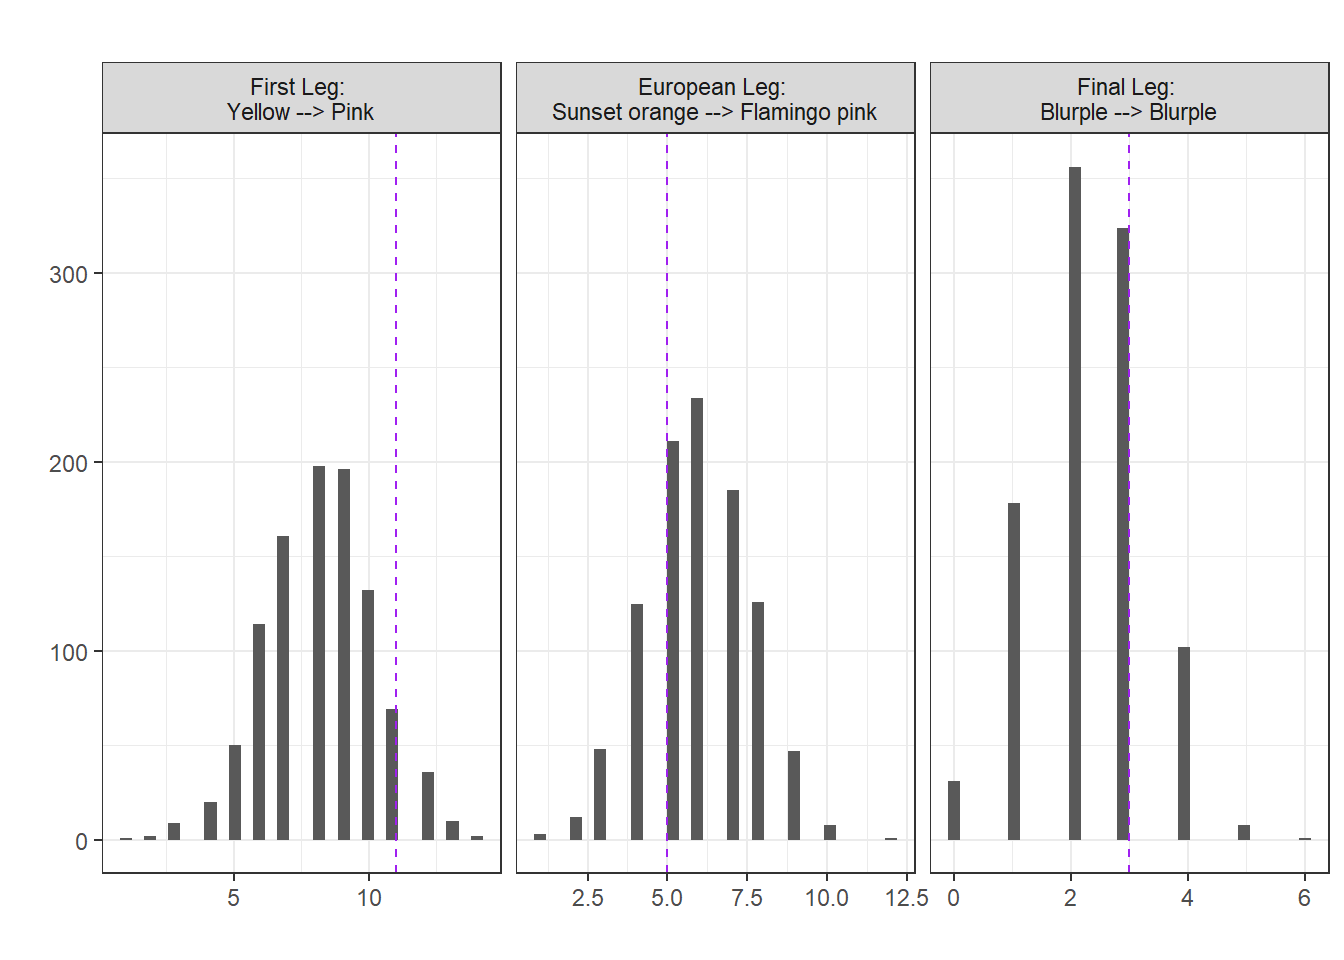
But, we can actually use any metric we like in a randomisation test! For our example, the \(\chi^2\) is a nice (distance) statistic because it considers all the transitions, but if we were particularly interested in, say, a particular transition (e.g., Yellow \(\rightarrow\) Pink for the first leg) we could look at those instead.
\(H_0 = \text{A particular transition occured at random}\)
vs.
\(H_1 = \text{A particular transition occured fewer or more times than expected}\).
[Note: than expected means than was expected under chance alone.]
## create a new function for the randomisation test using the ## numbers of a particular transition (from --> to)randomisation <-function(data, from ="Yellow", to ="Pink", nreps =1000, seed =1984){ sampling_dist <-numeric(nreps)set.seed(seed) for (i in1:nreps) { sampling_dist[i] <- (sample(data) |>transitions())[from, to] }return(sampling_dist)}
## European leg, Sunset orange --> Flamingo pinknull_mid <-randomisation(mid_leg, from ="Sunset orange", to ="Flamingo pink")obs_mid <- (mid_leg |>transitions())["Sunset orange", "Flamingo pink"]mean(abs(null_mid -mean(null_mid)) >=abs(obs_mid -mean(null_mid)))
[1] 0.766
## Final leg, Blurple --> Blurplenull_final <-randomisation(final_leg, from ="Blurple", to ="Blurple")obs_final <- (final_leg |>transitions())["Blurple", "Blurple"]mean(abs(null_final -mean(null_final)) >=abs(obs_final -mean(null_final)))
[1] 0.644
Sampling distribution of the test statistic (the number of times a particular transition occured) under the NULL hypothesis for each leg along with the observed test statistic in purple.
In each case, no evidence to suggest we see the particular transitions more or less frequently than would be expected under the NULL hypothesis of chance alone. (Note the transitions were chosen arbitrarily)
3.3 A likelihood ratio test
What about using a model based approach? If the outfits were random (given the choices) then we’d expect each to occur independently of one another (i.e., the chance of one outfit is independent of any other).
Let’s consider the first leg, defining the events mathematically we let \(\{X_1, X_2, \ldots, X_n\}\) be the outfits taking values in \(\{\text{Blue}, \text{Green}, \text{Pink}, \text{Yellow}\}\) (i.e., four possible categories).
If the outfits were independent then we can write the likelihood as
Here \(p_j\) is the probability of observing category \(j\), \(n_j\) is the number of times category \(j\) appears from \(t=2\) to \(n\), and \(\sum_{j=1}^{k} p_j = 1\). The log-likelihood is therefore \[\log L_0(p;x) = \sum_{t=2}^{n} \log p_{x_t} = \sum_{j=1}^{4} n_j \log p_j\].
Calculating this in Rstep-by-step
n <-length(first_leg)n
[1] 81
k <-length(unique(first_leg))k
[1] 4
chain <-as.factor(first_leg)chain
 [1] Pink   Green  Pink   Green  Green  Pink   Yellow Pink   Green  Yellow
[11] Pink   Green  Green  Pink   Yellow Pink   Green  Yellow Pink   Yellow
[21] Green  Yellow Green  Pink   Pink   Green  Yellow Pink   Green  Yellow
[31] Pink   Yellow Yellow Pink   Green  Pink   Pink   Yellow Yellow Pink
[41] Green  Pink   Pink   Yellow Pink   Pink   Pink   Pink   Yellow Green
[51] Blue   Blue   Pink   Green  Yellow Blue   Pink   Yellow Yellow Blue
[61] Green  Blue   Yellow Green  Blue   Yellow Pink   Green  Yellow Pink
[71] Blue   Pink   Blue   Yellow Green  Yellow Green  Pink   Pink   Yellow
[81] Blue
Levels: Blue Green Pink Yellow
Now, what about the likelihood if we assume the sequence of outfits is a first-order Markov chain (i.e., the current outfit \(X_t\) depends on the previous one \(X_{t-1}\)):
Here \(P_{i,j}\) is the probability of transitioning from state \(i\) to state \(j\), again with \(\sum_{j=1}^{k} P_{i,j} = 1 \quad \text{for all } i\). We can write the likelihood as
## transition probability matrixtm <-prop.table(transitions(first_leg), 1) ## over rowstm
               Blue      Green       Pink     Yellow
  Blue   0.12500000 0.12500000 0.37500000 0.37500000
  Green  0.15000000 0.10000000 0.35000000 0.40000000
  Pink   0.06896552 0.37931034 0.24137931 0.31034483
  Yellow 0.13043478 0.26086957 0.47826087 0.13043478
## using a for loopll1 <-0## initialisefor(i in2:n){ lli <-log(tm[chain[i-1], chain[i]]) ## element of tm ll1 <- ll1 + lli}ll1 ## log likelihood assuming a first-order Markov chain
[1] -99.9088
## we can benchmark using the markovchain package markovchain::markovchainFit(data = first_leg, method ="mle")$logLikelihood
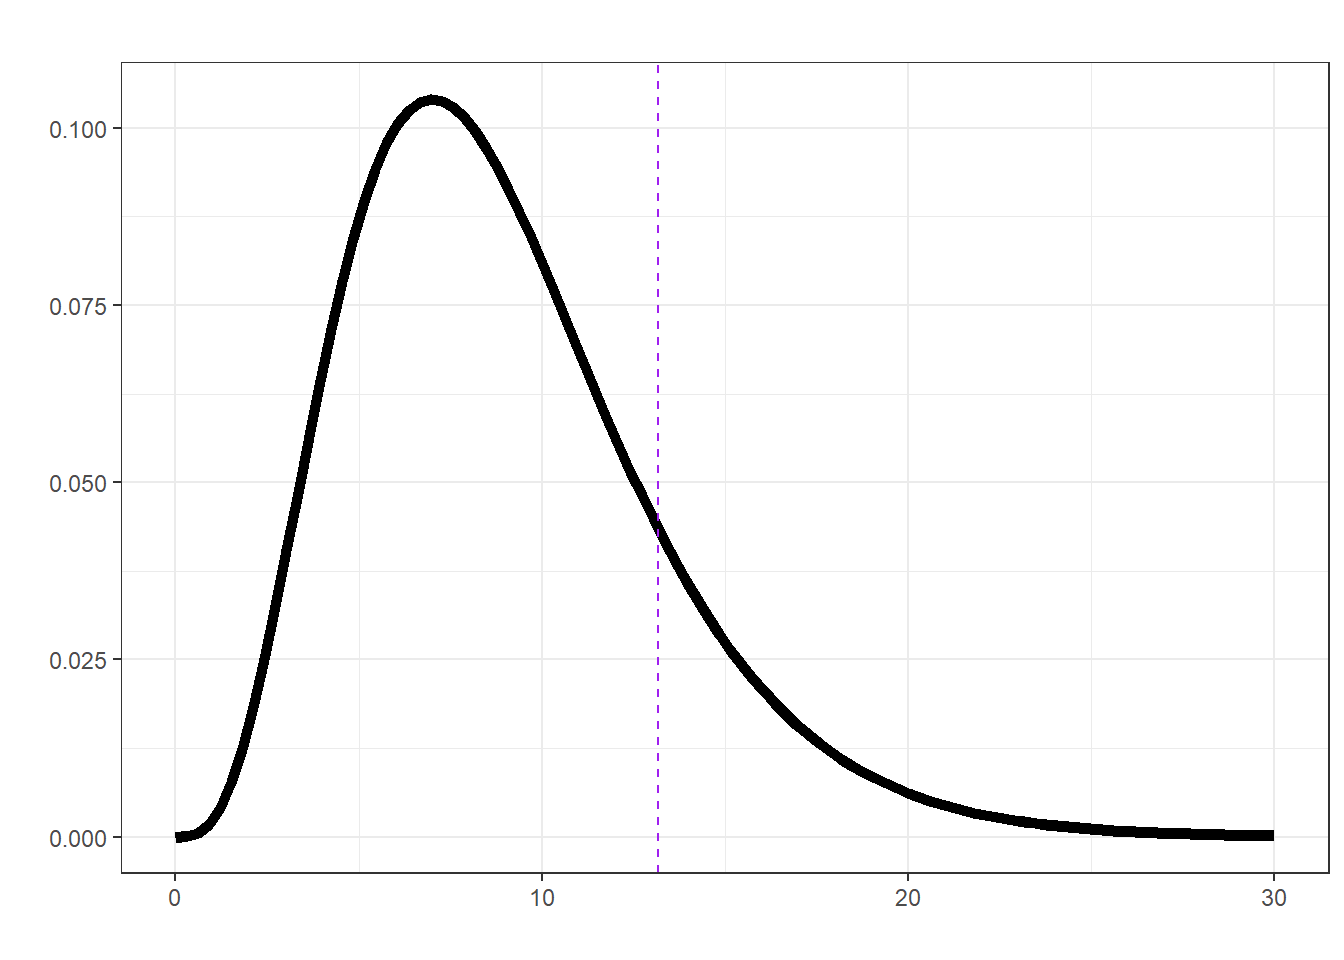
Under the NULL hypothesis \(H_0\), the test statistic \(\Lambda\) asymptotically follows a \(\chi^2\) distribution with degrees of freedom \(\text{df} = (k - 1)^2\).
So, might we believe that for the European leg of her tour Swift’s outfits weren’t random and perhaps what she wore one night depended on her outfit the previous night (i.e., in stats speak followed a first-order Markov chain)?
Note
Basically, the first-order Markov property is that the future state of a system depends only on its current state and is independent of its past history.
require(markovchain)verifyMarkovProperty(mid_leg) ## no evidence against the Markov property p-value 0.834 (~likely a Markov chain?)
Testing markovianity property on given data sequence
Chi - square statistic is: 7.339583
Degrees of freedom are: 12
And corresponding p-value is: 0.8343811
markovchainFit(data = mid_leg, method ="mle") ## as above but with ses :)
$estimate
MLE Fit
 A  3 - dimensional discrete Markov Chain defined by the following states:
 Flamingo pink, Ocean blue, Sunset orange
 The transition matrix  (by rows)  is defined as follows:
              Flamingo pink Ocean blue Sunset orange
Flamingo pink    0.06666667  0.2666667     0.6666667
Ocean blue       0.57142857  0.0000000     0.4285714
Sunset orange    0.27777778  0.5555556     0.1666667


$standardError
              Flamingo pink Ocean blue Sunset orange
Flamingo pink    0.06666667  0.1333333    0.21081851
Ocean blue       0.20203051  0.0000000    0.17496355
Sunset orange    0.12422600  0.1756821    0.09622504

$confidenceLevel
[1] 0.95

$lowerEndpointMatrix
              Flamingo pink  Ocean blue Sunset orange
Flamingo pink    0.00000000 0.005338081    0.25346989
Ocean blue       0.17545597 0.000000000    0.08564909
Sunset orange    0.03429924 0.211224910    0.00000000

$upperEndpointMatrix
              Flamingo pink Ocean blue Sunset orange
Flamingo pink     0.1973310  0.5279953     1.0000000
Ocean blue        0.9674012  0.0000000     0.7714938
Sunset orange     0.5212563  0.8998862     0.3552643

$logLikelihood
[1] -39.26825
What about 1st vs 2nd Markov Chain
## Let's trick markovchain into doing this for us## by creating a "first order" chain which is actually of order 2snap <-data.frame(current = mid_leg)snap$future <-lead(snap$current, 1)snap$past <-lag(snap$current, 1)sec_order <- snap |>filter(!is.na(future) &!is.na(past)) %>% tidyr::unite("y_current", c("past", "current"), remove =FALSE) |>mutate(y_next =lead(y_current, 1),y_previous =lag(y_current, 1))ll1 <-markovchainFit(data = mid_leg, method ="mle")$logLikelihoodll1
[1] -39.26825
ll2 <-markovchainFit(data = sec_order$y_current, method ="mle")$logLikelihoodll2 ## eyeballing this, looks pretty similar to 1st order
[1] -32.29189
For fun let’s also calculate the 2nd order Markov Chain likelihood manually.
## function to calculate the log likelihood assuming a second-order Markov chainll2 <-function(x){ n <-length(x) k <-length(unique(x)) chain <-as.factor(x)## Initialize 3D transition count array counts <-array(0, dim =c(k, k, k)) int <-as.integer(chain)for (t in3:n) { a <- int[t -2] b <- int[t -1] c <- int[t] counts[a, b, c] <- counts[a, b, c] +1 }## Calculate conditional probabilities probs <- countsfor (a in1:k) {for (b in1:k) { total <-sum(counts[a, b, ])if (total >0) {probs[a, b, ] <- counts[a, b, ] / total} } } ll <-0for (t in3:n) { a <- int[t -2] b <- int[t -1] c <- int[t] p <- probs[a, b, c]if (p >0) {ll <- ll +log(p)} }return(ll)}## 2nd order Markov Chain log-likelihoodll2(mid_leg)
Bortoli, Mario De, and Jesús Maroto. 2001. “Colours Across Cultures: Translating Colours in Interactive Marketing Communications.” In European Languages and the Implementation of Communication and Information Technologies (Elicit) Conference.